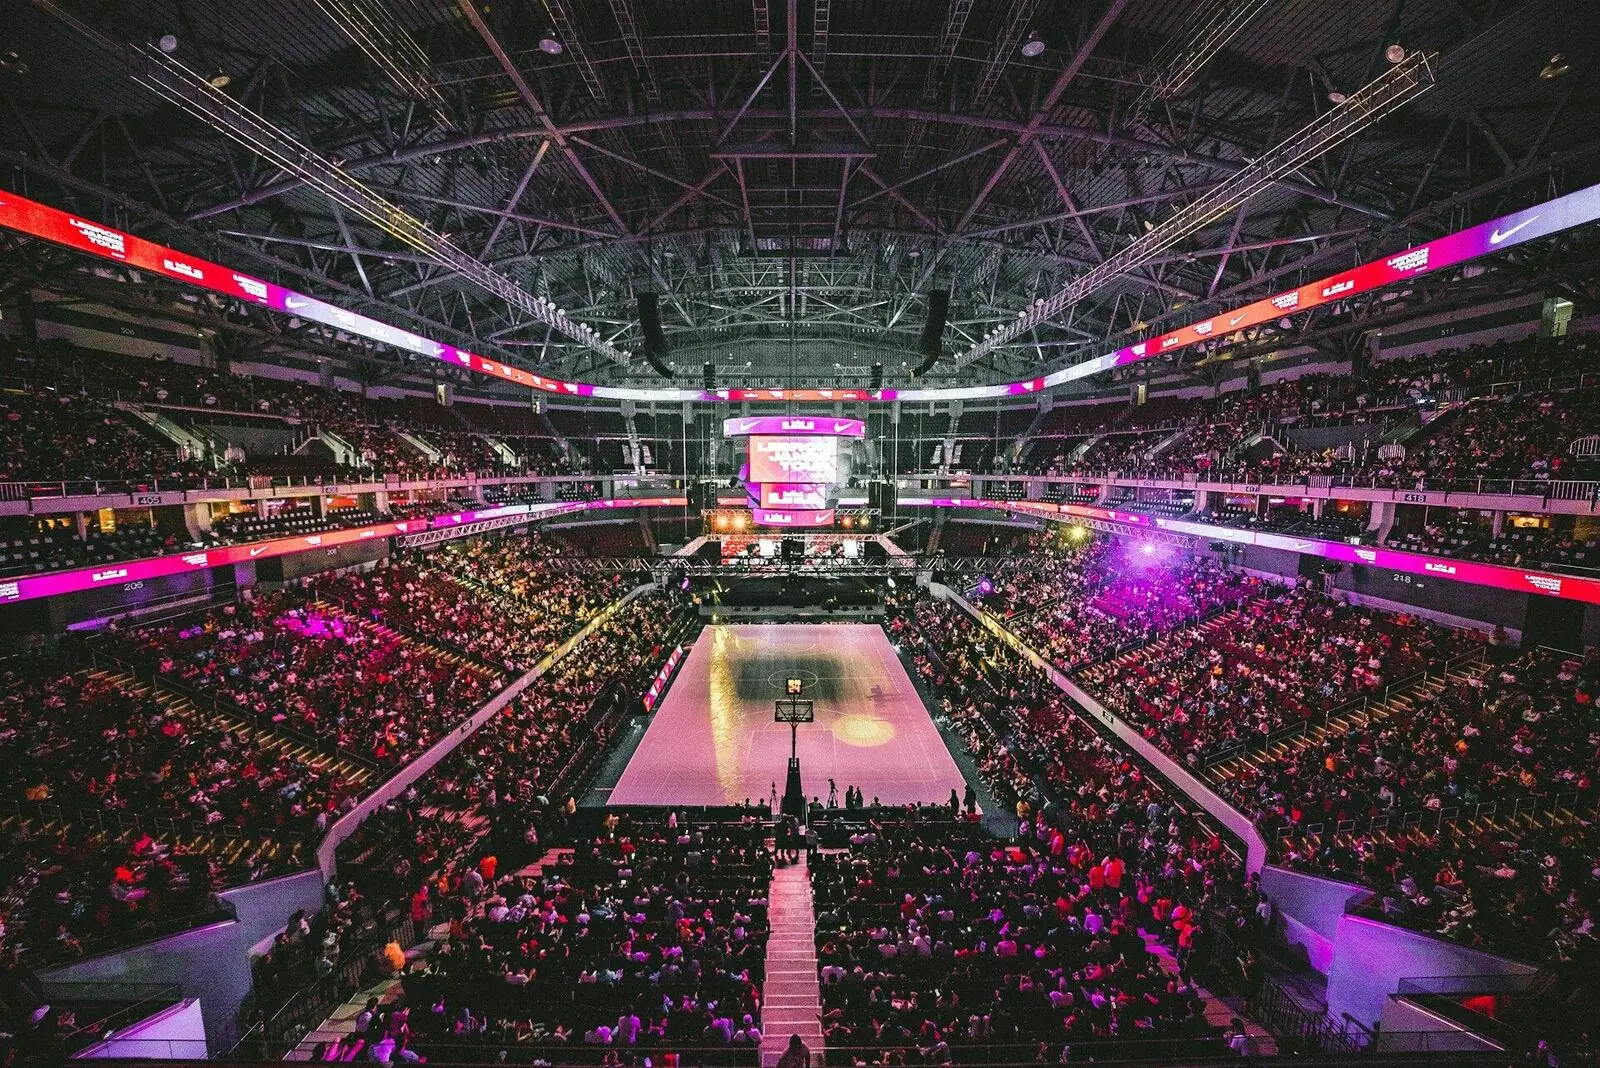
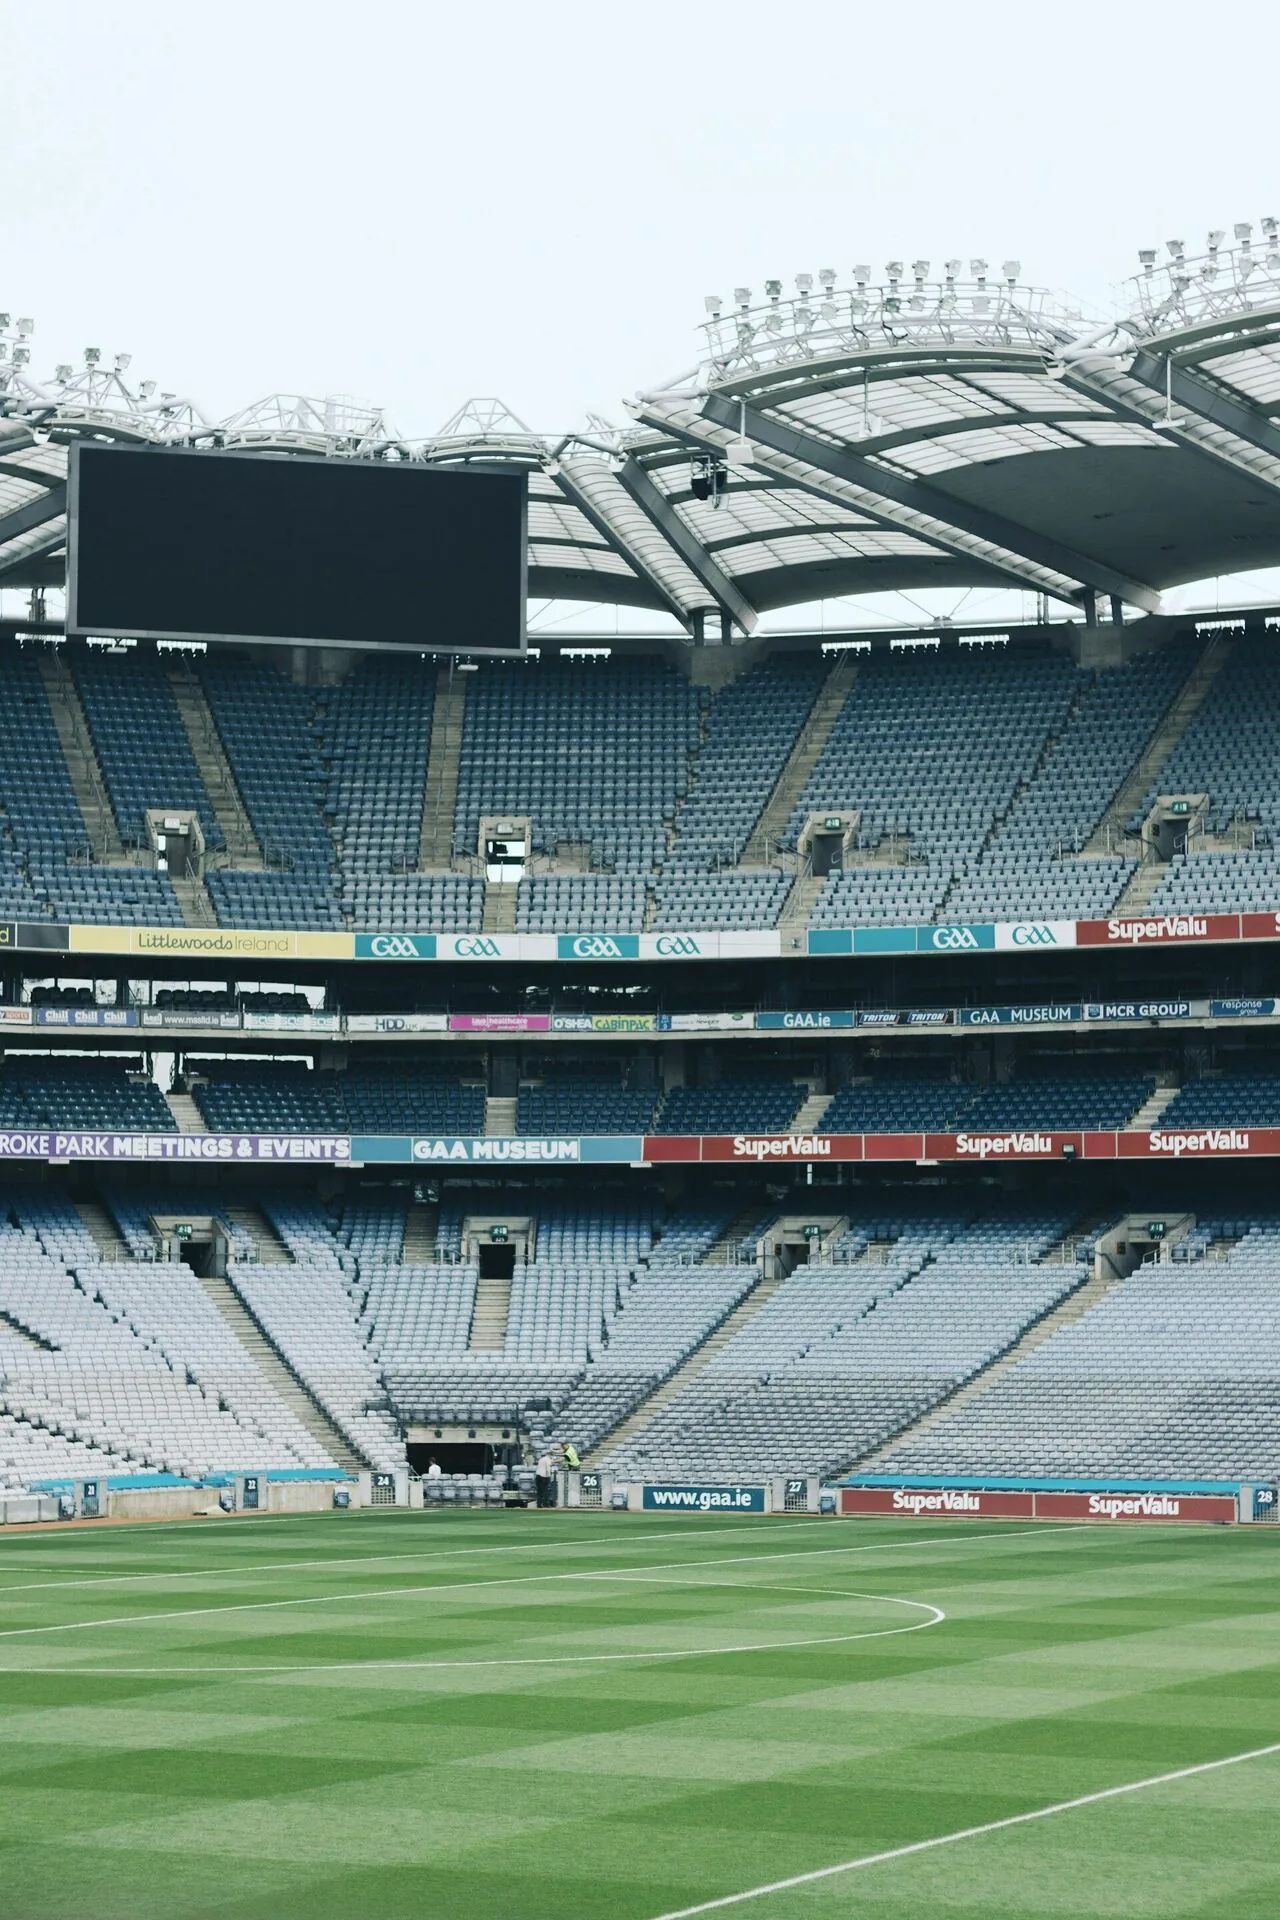

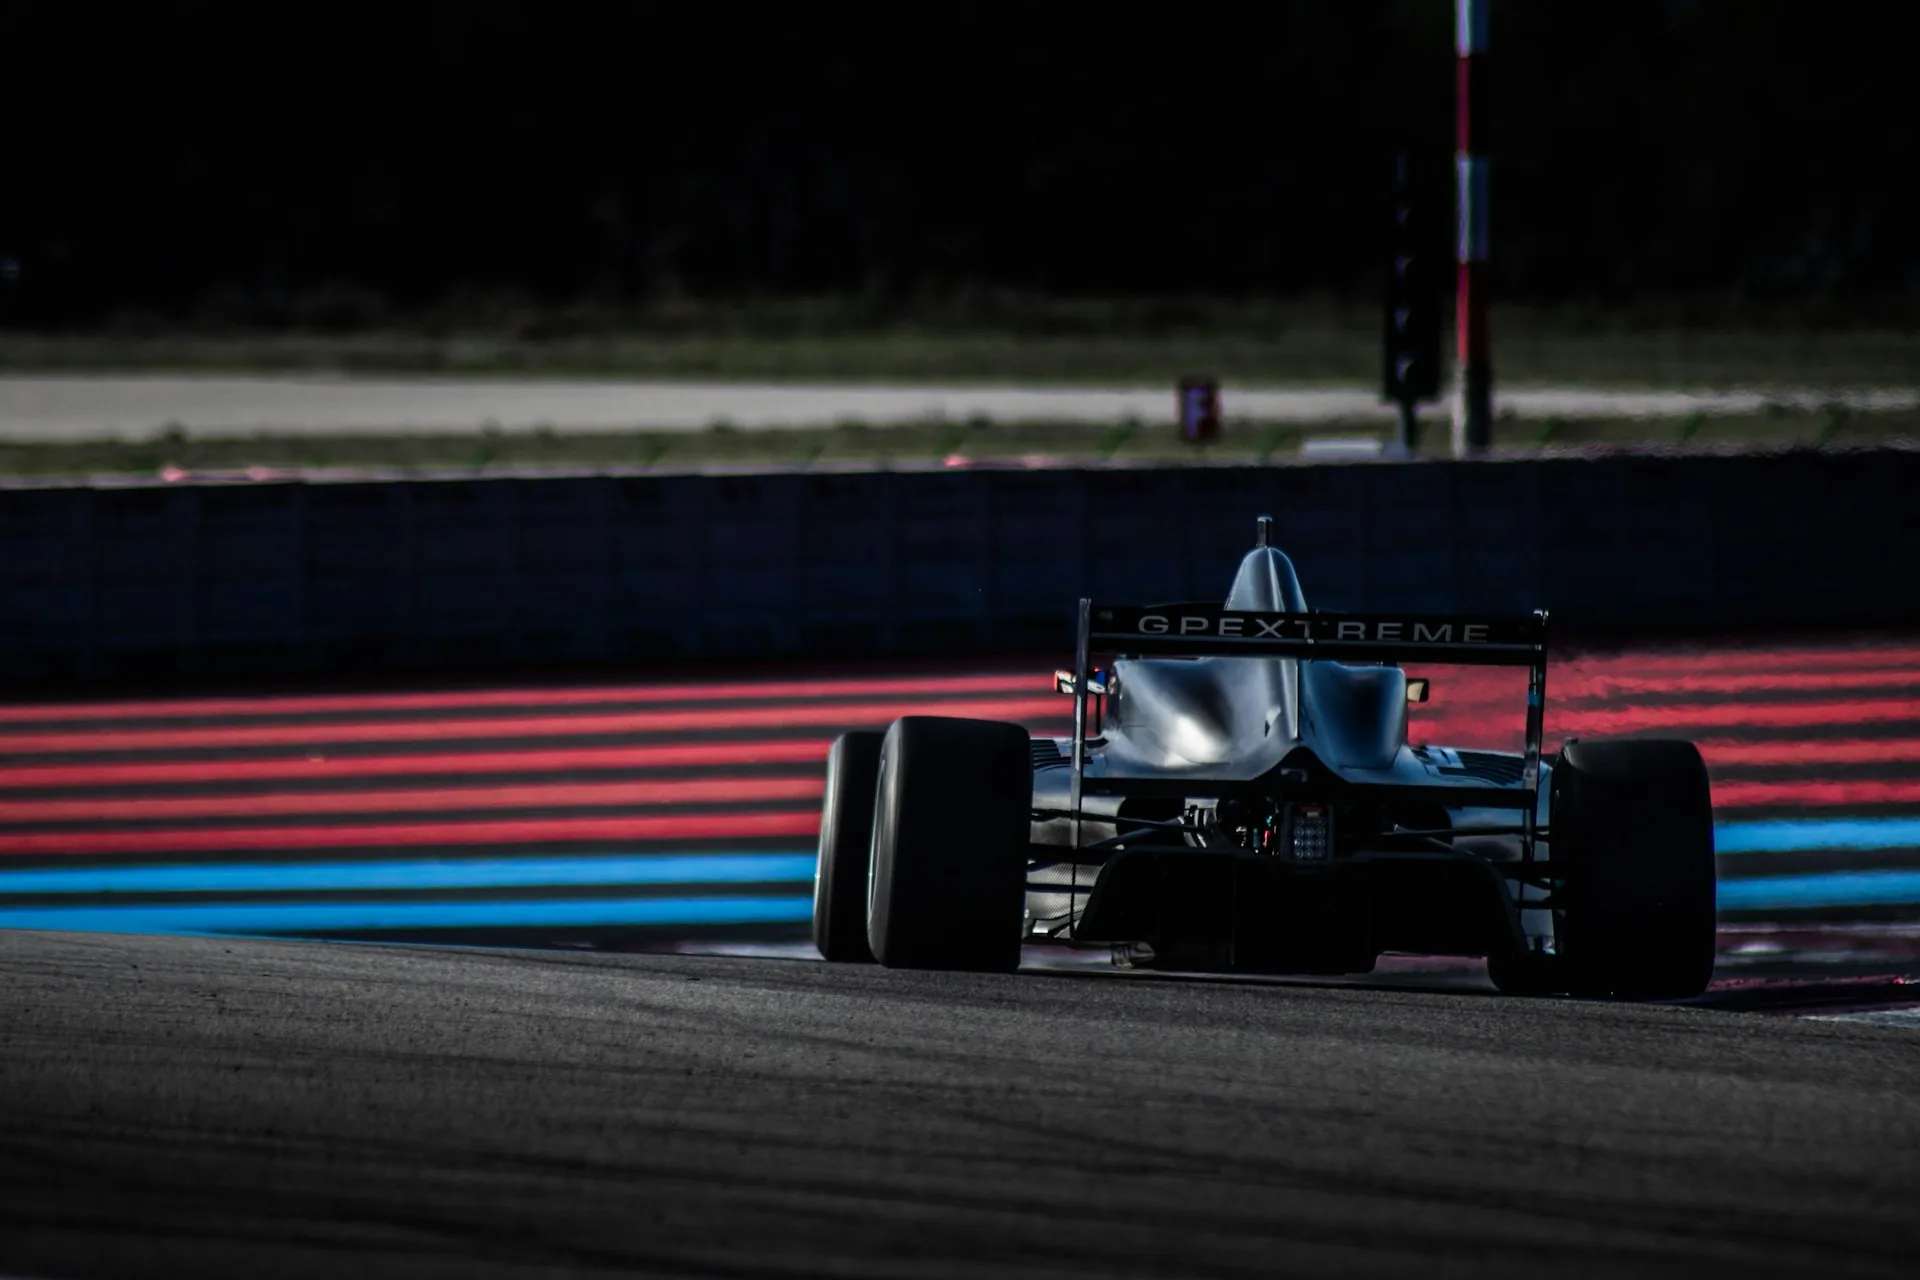
Every broadcast. Every frame.Priced.
Capture every second of brand exposure with real-time precision across global broadcasts.
The machine eye, on air
Real-time analysis across multiple assets and sponsors: hover a monitor to bring its feed on air.
What the machine eye extracts
Six signals per detection, every frame, streamed straight into the valuation engine.
Every second on air, valued
Exposure time, screen share, clarity and position, fused into a euro value per asset, per feed, per second.
Model calibrated per sport, competition and broadcaster rate card.
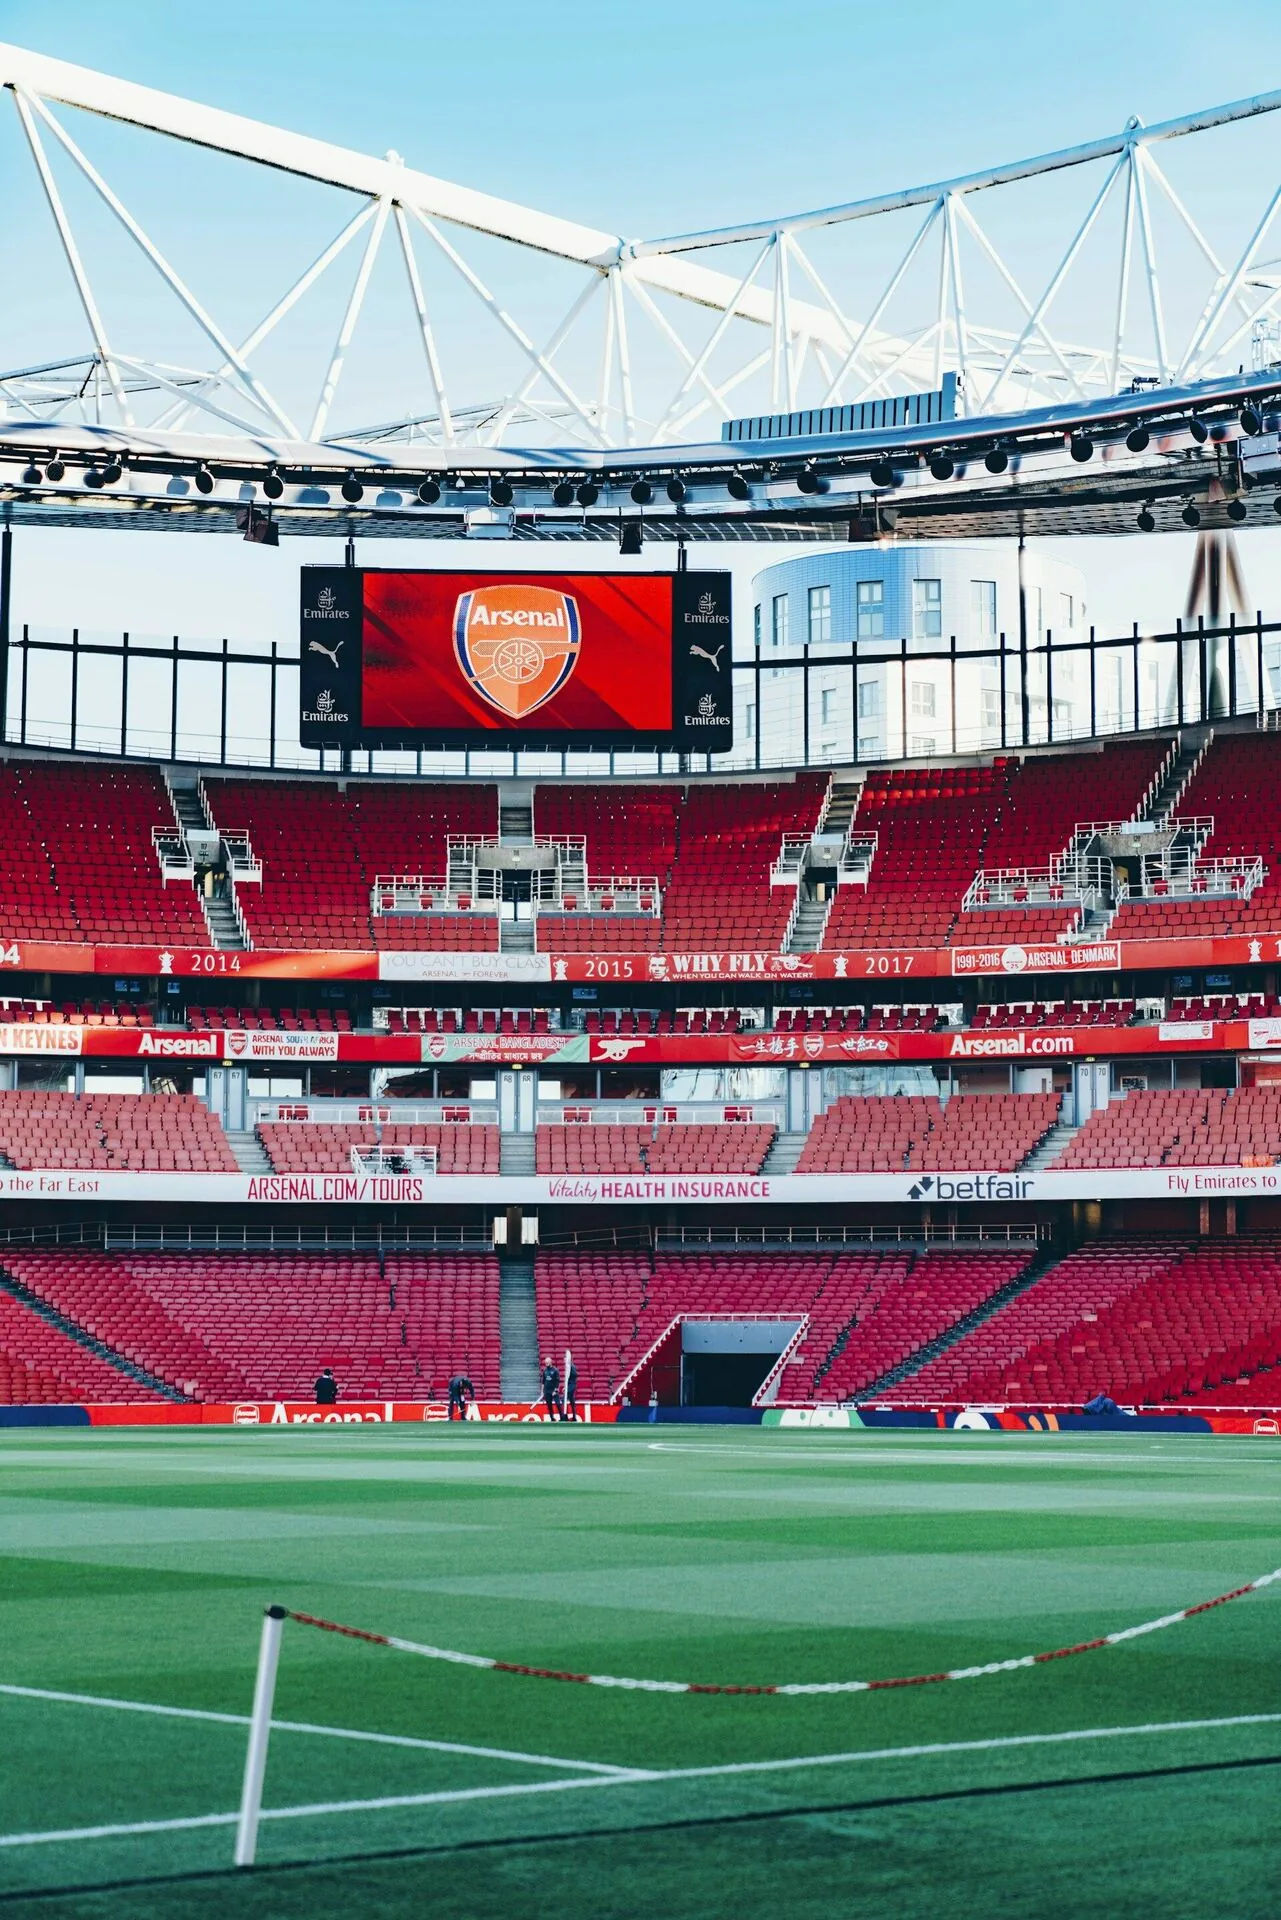
One match, every second accounted
A full broadcast on the editing table: five sponsor assets, every appearance cut as a clip on the timeline, and a ledger that accrues euro by euro as the match plays.
Composite match. The rates behind every lane come from the same calibrated model that prices each second in 02 / Valuation.
07:30
- Score bug
- 07:00€13K
- Shirt front
- 03:00€20K
- LED ring
- 01:12€8K
- Pitch mat
- 00:00€0K
- Interview backdrop
- 01:12€5K
€46K
Frame-by-frame precision
Every millisecond of brand exposure, quantified and valued.
AI Frame-by-Frame Detection
Advanced computer vision identifies every sponsor appearance with millisecond precision, live or on-demand.
Screen Time Measurement
Track the exact duration each brand stays visible on screen, across all sessions and broadcast formats.
% Visible Area (Screen Share)
Quantify how much space each logo occupies relative to the total screen, giving a deeper layer of impact analysis.
Economic Valuation per Asset
Automated valuation models estimate ROI by asset type: teams, trackside signage, uniforms, objects, vehicles, and more.
Multi-Country, Multi-Feed Coverage
Analyze every international broadcast feed simultaneously to understand visibility across markets worldwide.
Quality & Context Scoring
Assess exposure quality based on clarity, camera angle, screen position, and contextual relevance.
Predictive Insights
Identify patterns, forecast value, and optimize sponsorship placements using historical performance.
Value Optimization Powered by Camaleonic AI
AI-powered optimization to maximize value generation and sponsorship performance across all channels.
Proof your board can audit
Every number traces back to a frame. Reports arrive broadcast-grade: time-coded, market-split and benchmark-ready.
Excerpt from a post-event report.

Evidence reel
Frame-accurate clips of every detection, time-coded for audit.
Asset ledger
Valuation per asset: boards, jerseys, gantries, vehicles and more.
Market split
Exposure and value per country and per broadcast feed.
Benchmark
Performance against rate card and previous events.
Our technology reveals what audiences truly see, and what each second is worth.
Key facts
How is sponsorship exposure on TV measured?
On-screen time, counted rather than estimated
Camaleonic analyses broadcast at the full frame rate of the feed, up to 60 frames per second, and every detection is traceable to the frame that produced it, so screen time is counted rather than estimated. Every detection carries 15+ KPIs, including exposure duration, screen area, clarity and zone quality, which the Camaleonic Score weighs into a single figure before any value is applied. The same pipeline runs live during a broadcast or afterwards against recorded footage.
Defined hereCamaleonic Score™Media valueCPM and CPT