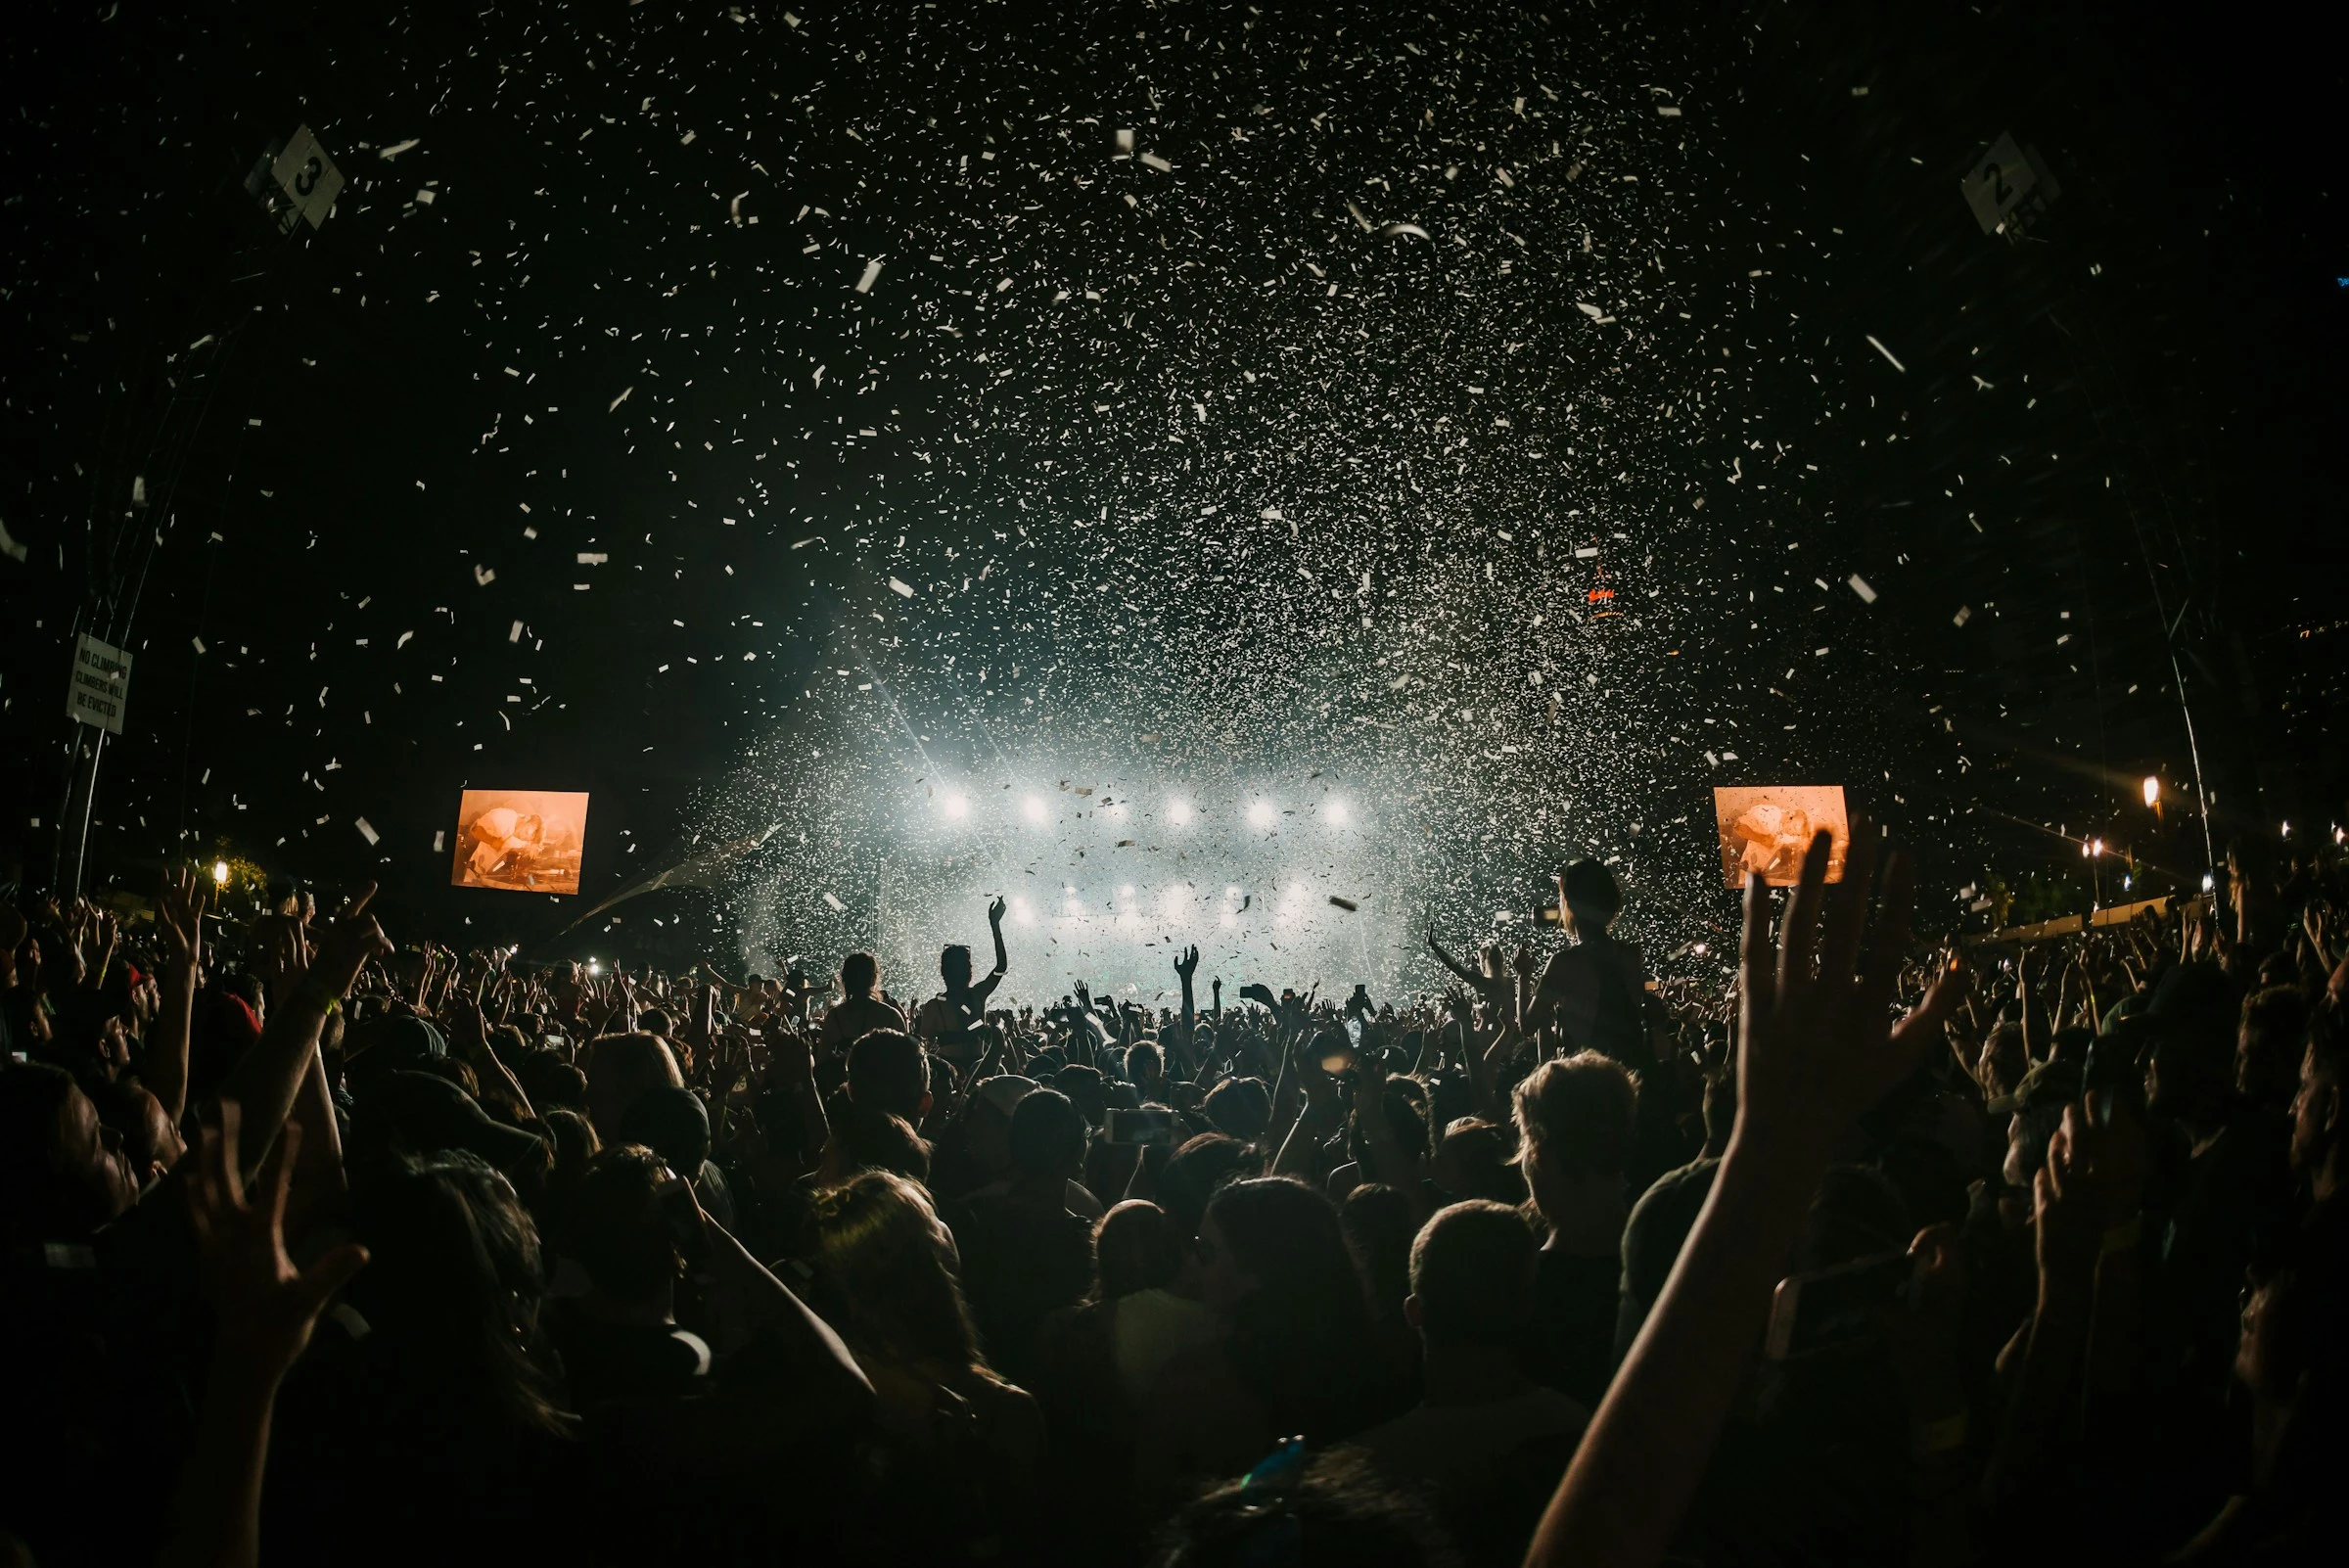
Every stage. Every sponsor.Heard.
Computer vision tracks sponsor exposure across streams, social, press and the venue floor at the world’s biggest music events, and values every second of it.
360° event coverage, end to end
Six detection services run in parallel, across streams, social platforms, press and the venue floor.
Live Stream Analytics
Real-time brand detection across Twitch, YouTube, and official festival streams worldwide.
Onsite Brand Asset Measurement
AI-driven onsite analysis to detect, measure, and value brand visibility across all physical assets within the venue.
Social Amplification
Track brand mentions, hashtags, and UGC across all social platforms during events.
Artist Integration
Measure brand exposure through artist partnerships, merch, and on-stage mentions.
Venue Impact & Economic Value
Measure the event’s economic and territorial impact, quantifying attendance, footfall, dwell time, and the value generated for the host city and region.
Media Clipping Impact Analysis
Comprehensive analysis of earned media coverage, measuring brand visibility, impressions, media value, and reach across digital and traditional press related to the event.
World-class events
Three flagship festivals, three measured outcomes.
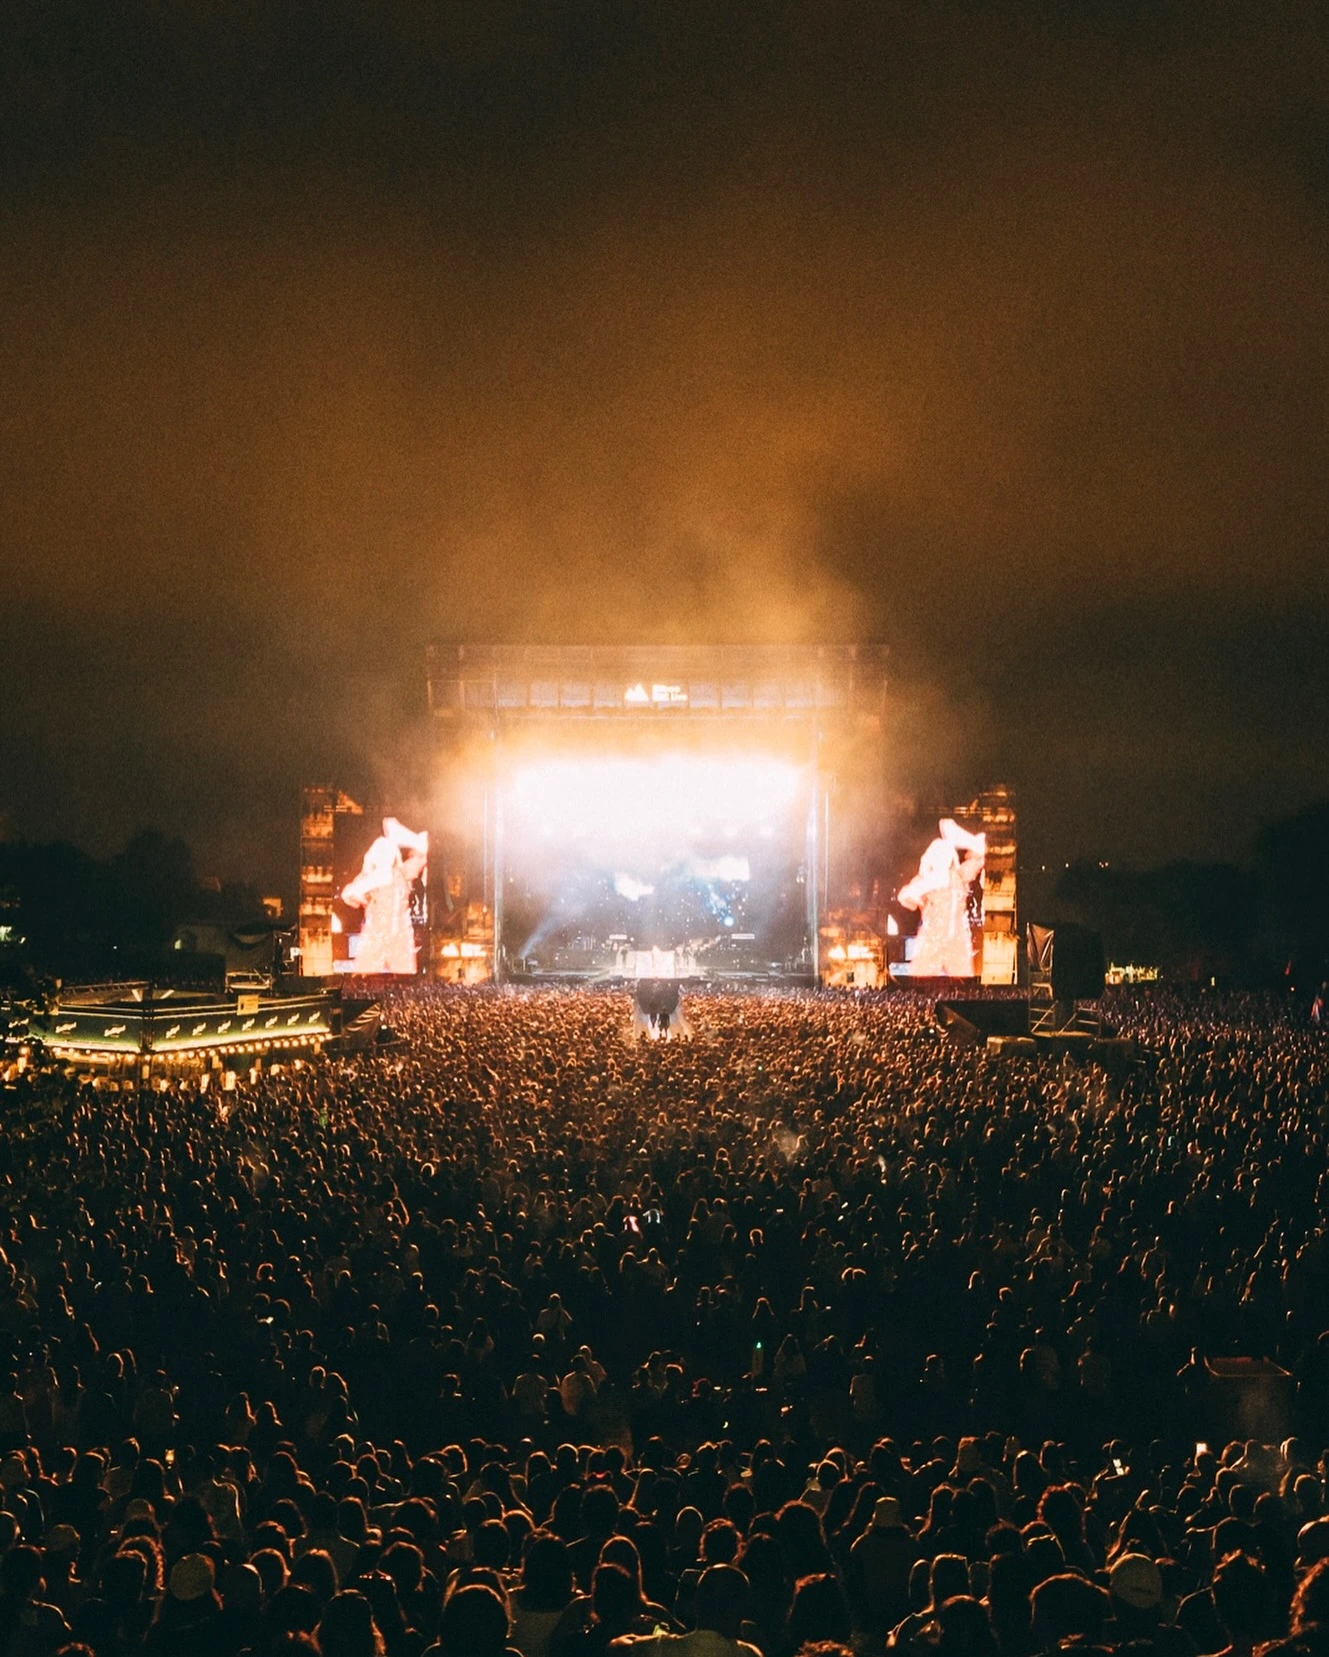
BBK LIVE
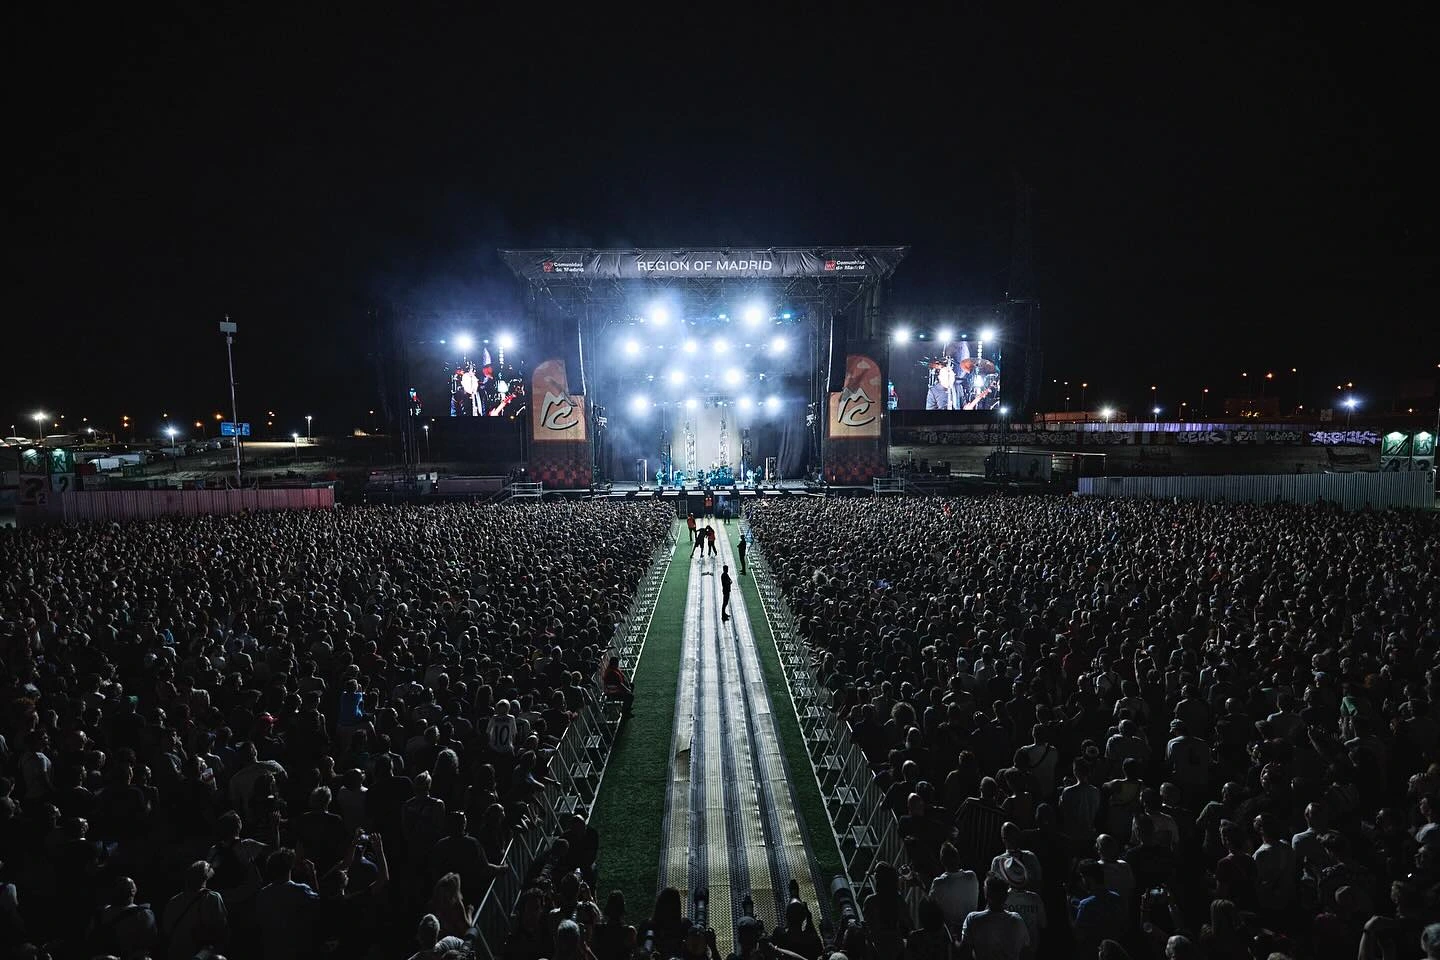
MAD COOL
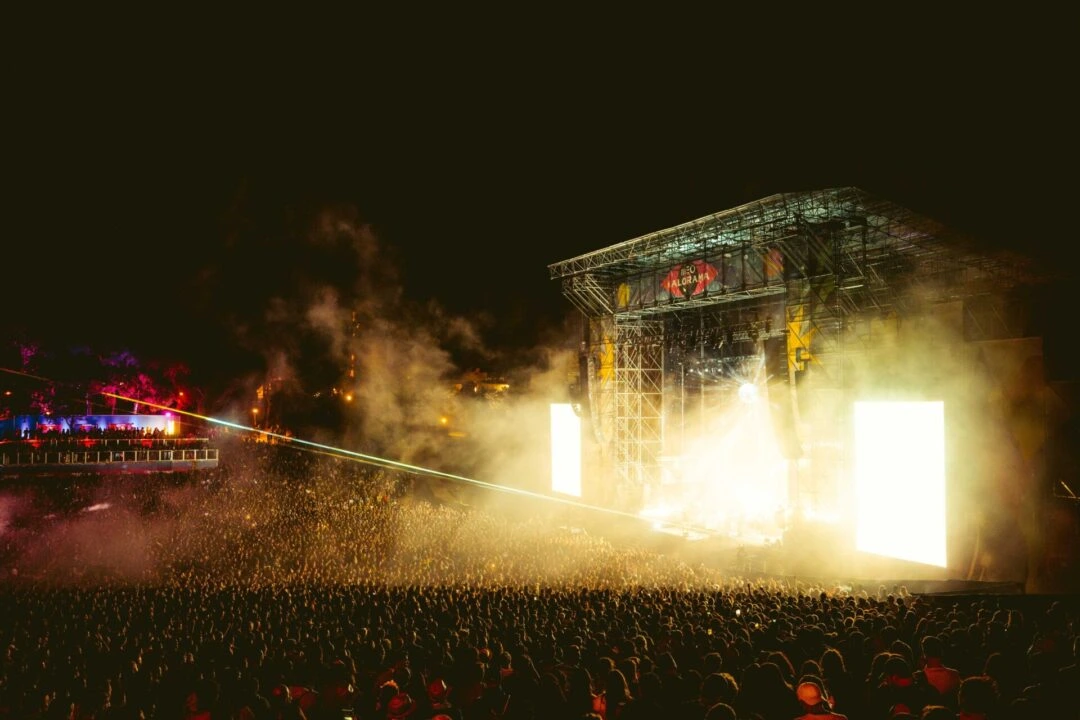
MEO KALORAMA
The venue as an AR console
Zone density, live sentiment and sponsor exposure resolve on one overlay while the show runs.
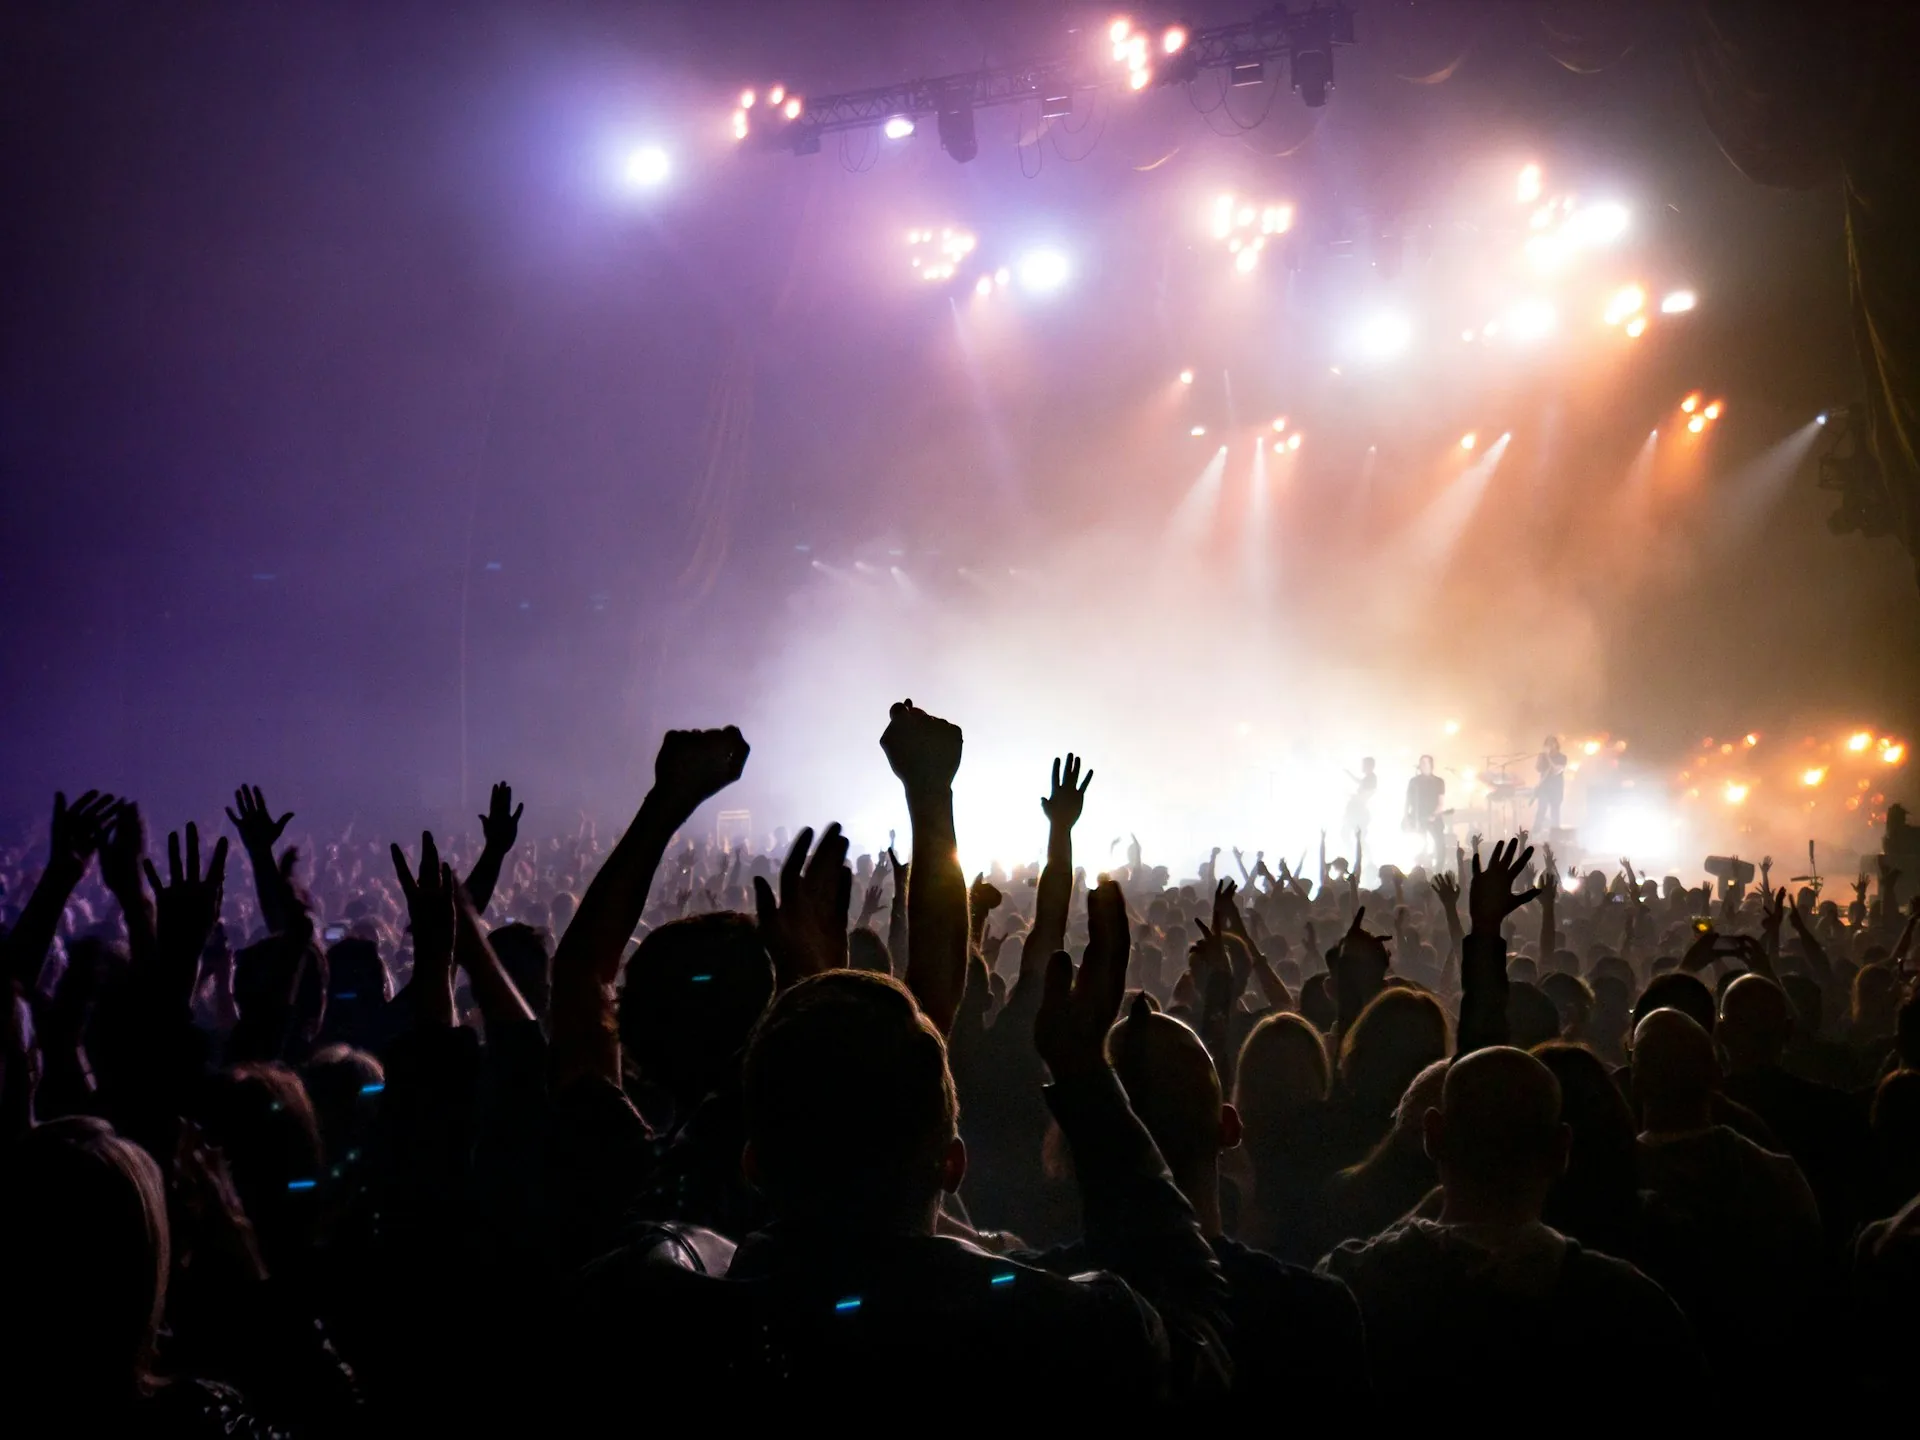
The rhythm of data intelligence
Every capability in the event console, indexed.
Multi-stage Tracking
Simultaneous monitoring across all festival stages and zones.
Real-time Sentiment
Instant analysis of crowd mood and social reaction.
Crowd Mapping
Heatmaps of attendee density and movement patterns.
Sponsor Metrics
Precise measurement of sponsor asset visibility and impact.
ROI Reporting
Comprehensive post-event return on investment analysis.
Benchmarking
Comparative analysis against direct competitor events.
Ready to amplify your event presence?
Join leading brands and events using Camaleonic Analytics.