Measured whereit happens.
AI-powered onsite analytics that measure how every brand asset performs in front of real attendees.
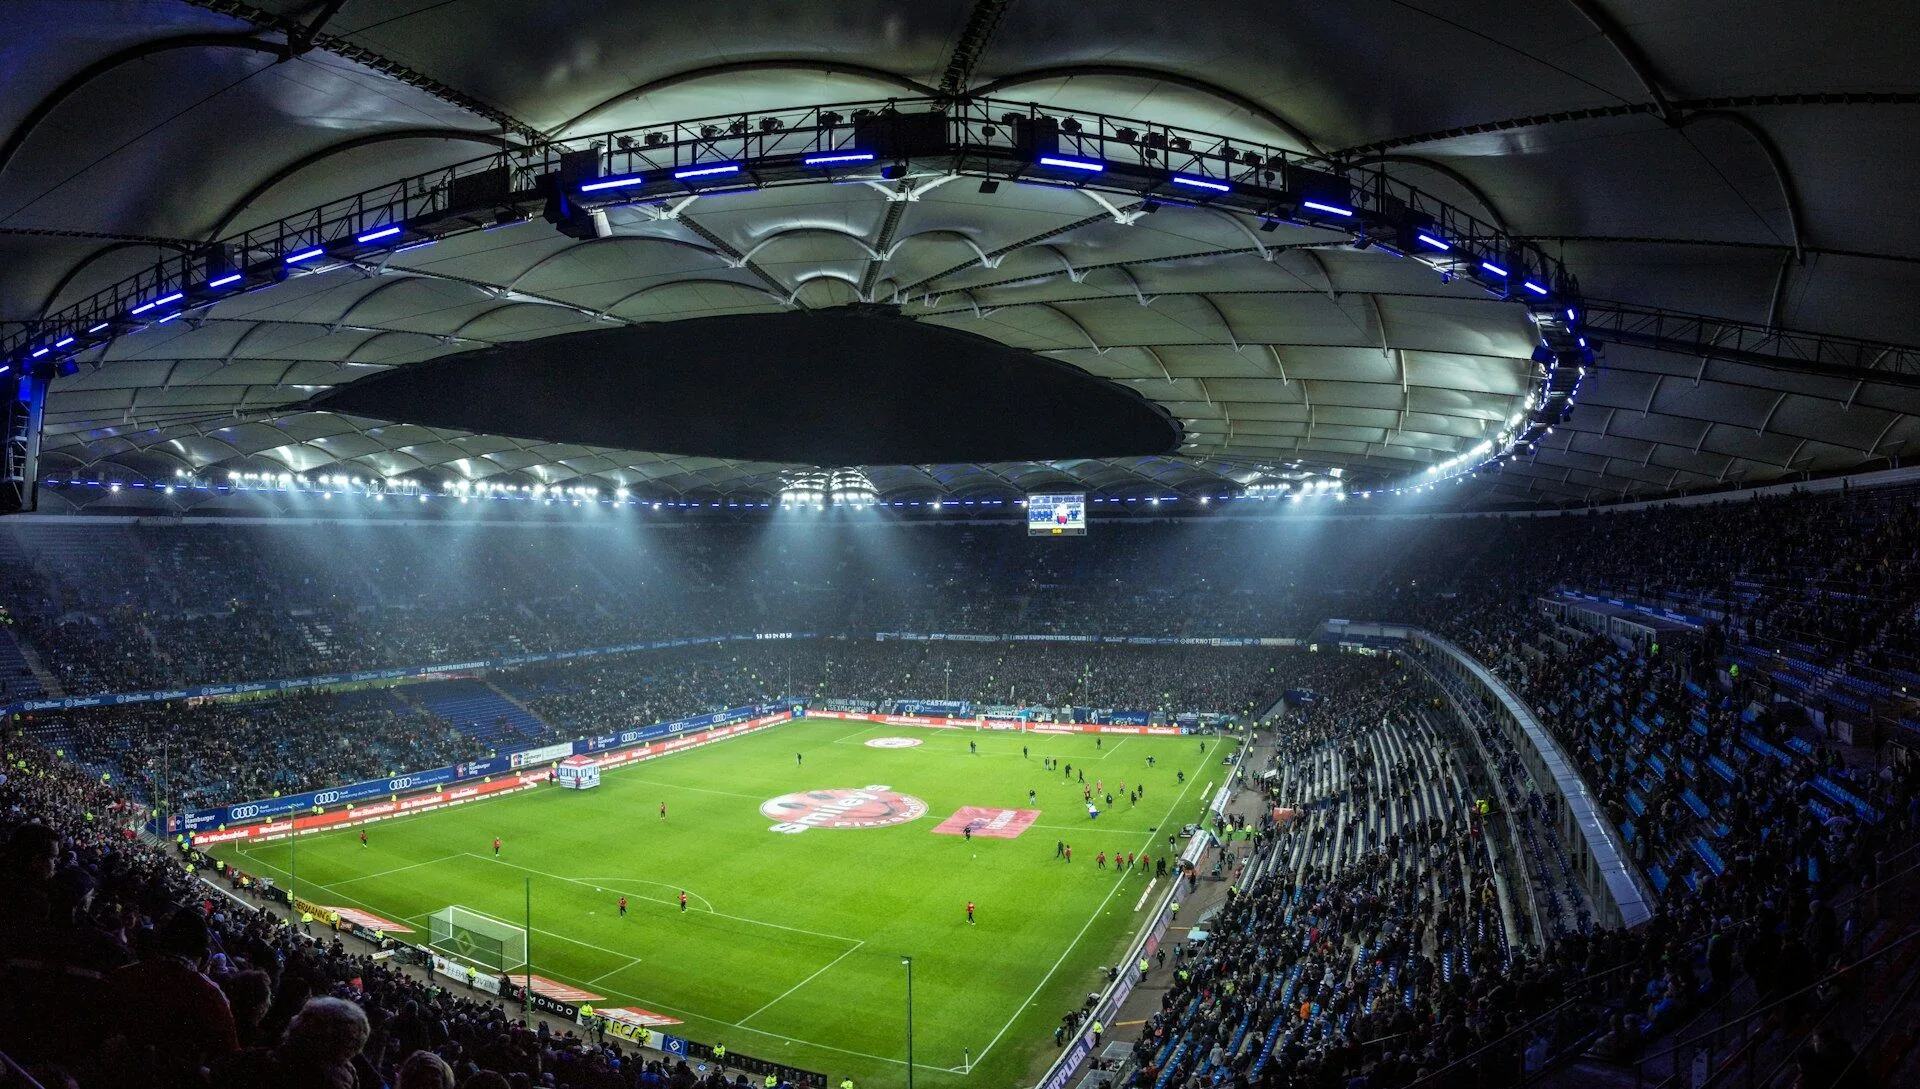
Onsite branding is a powerful yet underestimated sponsorship component. Camaleonic uses AI to capture, evaluate, and measure every brand appearance inside venues with precision.
From banners to LED boards, structures, activations, and experiential zones, we quantify how each asset performs and the value it generates for sponsors.
Every asset, detected frame by frame
Camaleonic analyzes all brand assets inside the event using advanced computer vision, identifying visibility, prominence, clarity, and area exposed.

/Every asset is evaluated with qualitative and quantitative scoring.
Every banner. Every LED board. Every activation. Seen and scored.
Audience impact & exposure quality
Understand who sees each asset and how they see it.
Average exposures per attendee
Track how many times each visitor sees your brand assets
Viewing angles
Analyze optimal sight lines and visual accessibility
Proximity
Measure distance and engagement potential with attendees
Emotional relevance of placement
Evaluate brand positioning in high-impact emotional moments
Key movement zones
Identify primary foot traffic patterns and hot zones
Congestion points
Detect areas of maximum audience concentration
The onsite impact methodology
Using Camaleonic’s proprietary AI-driven methodology, we compute the full performance of each asset.
For the first time, onsite can be measured with the same precision as TV or Social.
Contracted vs delivered. Clear, transparent, verifiable.
Onsite Analysis enables brands to clearly validate what was delivered.
Onsite impact is no longeran estimate. It's a science.
Camaleonic transforms physical visibility into measurable economic value.
Key facts
How is sponsorship signage inside a venue measured?
Physical signage valued like screen time
Camaleonic measures 48+ branded assets per venue, tracking footfall, dwell time and how audiences actually move through the site. Physical signage is valued on the same basis as broadcast exposure, so a perimeter board and a television graphic appear in one report in one currency. That is what lets a rights holder price inventory historically sold on floor plans and estimates.
Defined hereMedia valueCamaleonic Score™Sponsorship valuation