M.01AI / FRAME-BY-FRAME
Detect
25+DATAPOINTS / SAI captures every appearance, frame by frame, across all six signals.
TVSMPRONVNLS
Live signal mixFRAMES ≤60/S · FULL FEED RATE
Our proprietary AI captures millions of datapoints. Our methodology turns each one into transparent, auditable, actionable economic value.
Methodology core / 04
Detect
25+DATAPOINTS / SAI captures every appearance, frame by frame, across all six signals.
Live signal mixFRAMES ≤60/S · FULL FEED RATE
Qualify
8WEIGHTED VARSThe KPI engine weighs 8 variables into one Camaleonic Score™.
Weighted variablesΣ 1.00
Audience
96%DEDUPLICATEDReach, frequency and demographics, deduplicated across every platform.
Audience reachREACH 14.2M · DEDUP ✓
Value
100%AUDITABLEEconomic models convert qualified exposure into market value.
Economic ledgerAUDITABLE ✓
CPM8.40
CPT0.12
EMV€/S
Verified outputs / 02
Economic intelligence you can defend
SCORE · CPM · CPT
Every number traceable to its frame
CSV · PPT · PDF
Camaleonic captures every second, every logo, every pixel, unlike traditional sampling-based manual methodologies.
Comparison
Both produce a number at the end of an event. The difference is what the number was built from, and whether anyone can check it.
| Dimension | Traditional media monitoring | Camaleonic |
|---|---|---|
| Coverage | A sample of the broadcast | Every frame of the feed, up to 60 per second |
| Method | Manual review | Computer vision, frame by frame across every signal |
| Output | Estimates and projections | Exposure counted, then priced with CPM and equivalent media value models |
| Verification | Taken on trust | Every export ships the detection records behind the figure |
From raw data capture to actionable economic intelligence.
Logos, variations, objects, and brand manifestations.
Training sets, quality control, image scoring.
Continuous improvement loop with scoring validation.
Extract exposure time, instances, area %, quality zone, clarity, and all KPIs in real-time.
Weighted KPI engine combining 8 variables into a unified performance metric.
CPM, CPT, audience data, interactions, venue metrics and market studies.
Score weighting
Two exposures of the same length are not worth the same. These are the weights that separate them, published in full because a number you cannot interrogate is not evidence.
| Variable | What it measures | Weight |
|---|---|---|
| Duration | Exposure duration | 0.18 |
| Size | On-screen size | 0.16 |
| Clarity | Visual clarity | 0.14 |
| Audience | Audience reach | 0.14 |
| Position | Screen position | 0.12 |
| Context | Context quality | 0.10 |
| Platform | Platform weight | 0.08 |
| Recall | Brand recall | 0.08 |
| Total | 1.00 |
Each service runs the same auditable pipeline with its own KPI set.
AI-powered frame-by-frame detection across all feeds. Uses Kantar audience data + advertising market references.
Detect brands across images, videos, text & audio mentions. Evaluates quantitative + qualitative + engagement metrics.
Monitor +5,000 media outlets daily with keyword-based extraction across text, images, videos, and voice.
AI evaluates Impact / Activation / Experience assets in physical venues. Extracts visibility, size, placement.
Quantify direct & induced economic impact: transport, accommodation, shopping, services with multiplier effects.
Real-time monitoring of brand keywords, crisis signals, sentiment fluctuations, and reputation patterns.
Every detection is exportable. Every KPI is traceable. Every number is auditable.
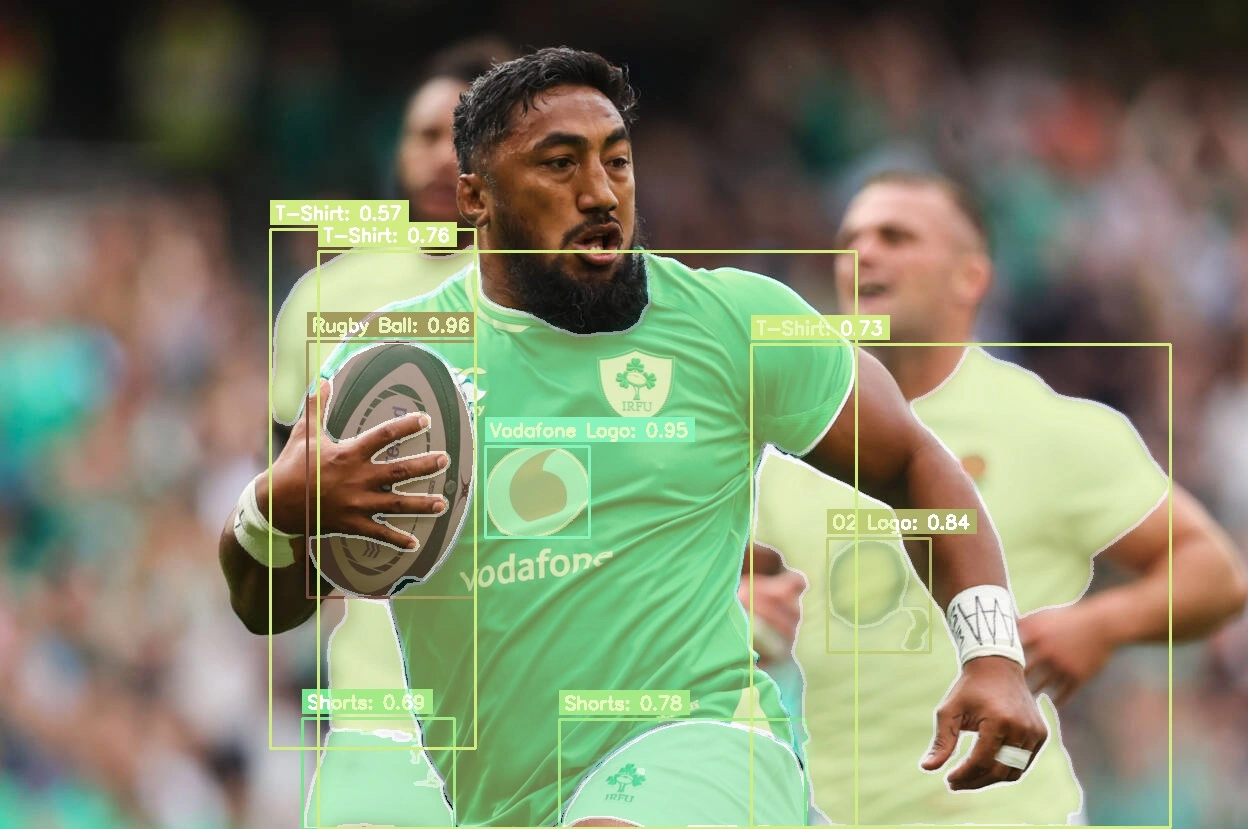
Visual proof of every brand appearance
Complete data export for verification
Frame-by-frame evidence included
Full transparency for stakeholders
This creates trust and differentiates Camaleonic from competitors.
Your data is secure, compliant, and ethically sourced. We adhere to the highest international standards.
Strict adherence to EU data protection regulations. No personally identifiable information (PII) is stored without consent.
You own your enhanced data. We provide full export capabilities and do not lock your insights behind a walled garden.
Our AI analyzes public feeds and authorized broadcasts only. We respect copyright and privacy boundaries globally.
See how our methodology transforms your sponsorship ecosystem.